| |
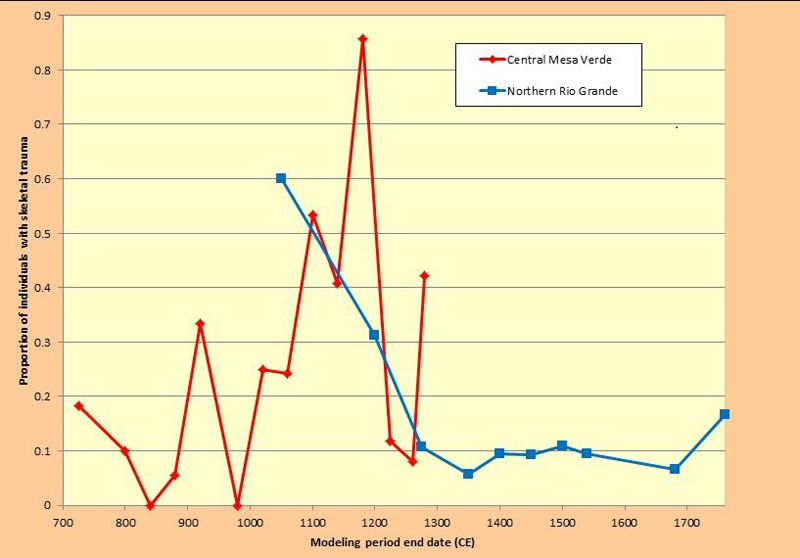
Incidence of Conflict Through Time in the Study Areas
Chart showing how the incidence of conflict changed through time in both the VEP North and South study areas. Notice how the conflict in the VEP North (the red line) varied considerably through time, but also note how it peaked during the late A.D. 1100s and again right before the migration from the region during the late A.D. 1200s. Compare that with the much different record of conflict in the VEP South study area (the blue line). In the VEP South, conflict was highest in the first period modeled by the VEP, A.D. 900–1050, but then it declined steadily and remained low after about A.D. 1300.

Graph by Crow Canyon Archaeological Center |


