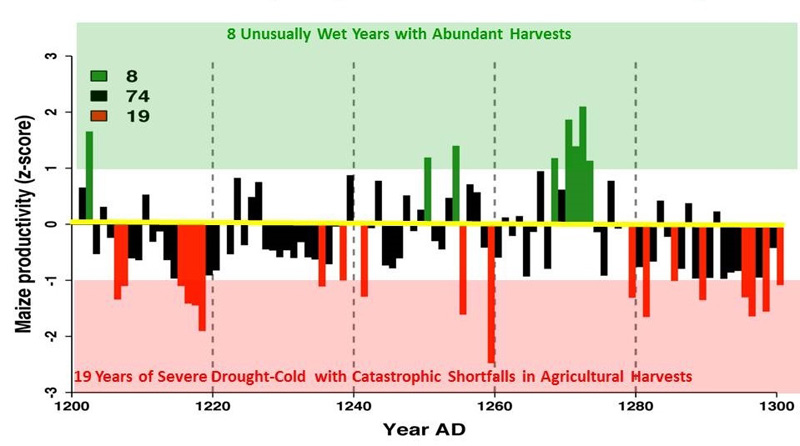
North Study Area Paleoproductivity in the A.D. 1200s
VEP scientists used tree-ring analysis to estimate precipitation and temperature and how it changed each year, and they combined these data with other ecological factors, including the distribution of the different types of soils in the study areas, to estimate how much maize could have been grown in the VEP study areas and how this varied from year to year.
This graph shows these results for the VEP North study area for the final century of occupation, the A.D. 1200s.

The horizontal yellow line in this image is the average yield for the entire study area for the years between A.D. 1200 and 1300.
Each vertical bar is an individual year. The black bars are years that were less than one standard deviation above or below this long-term average, or years when the departure from the average yield was not too extreme.
The green bars are years when exceptional moisture and favorable temperature produced unusually abundant yields.
The red bars are years when drought and unfavorable temperatures resulted in scarce yields.
As can be seen, the A.D. 1200s would have been a challenging century for ancestral Pueblo farmers in the VEP North study area. Agricultural shortfalls were likely an important factor that triggered a number of changes in Pueblo society during this century. Ultimately, the social response to these challenging conditions led to the migration of Pueblo people from the VEP North to the VEP South study areas, leaving the VEP North completely depopulated by the end of the century.
Graph by R. Kyle Bocinsky and Crow Canyon Archaeological Center |


