

| Question 4 supporting material | ||
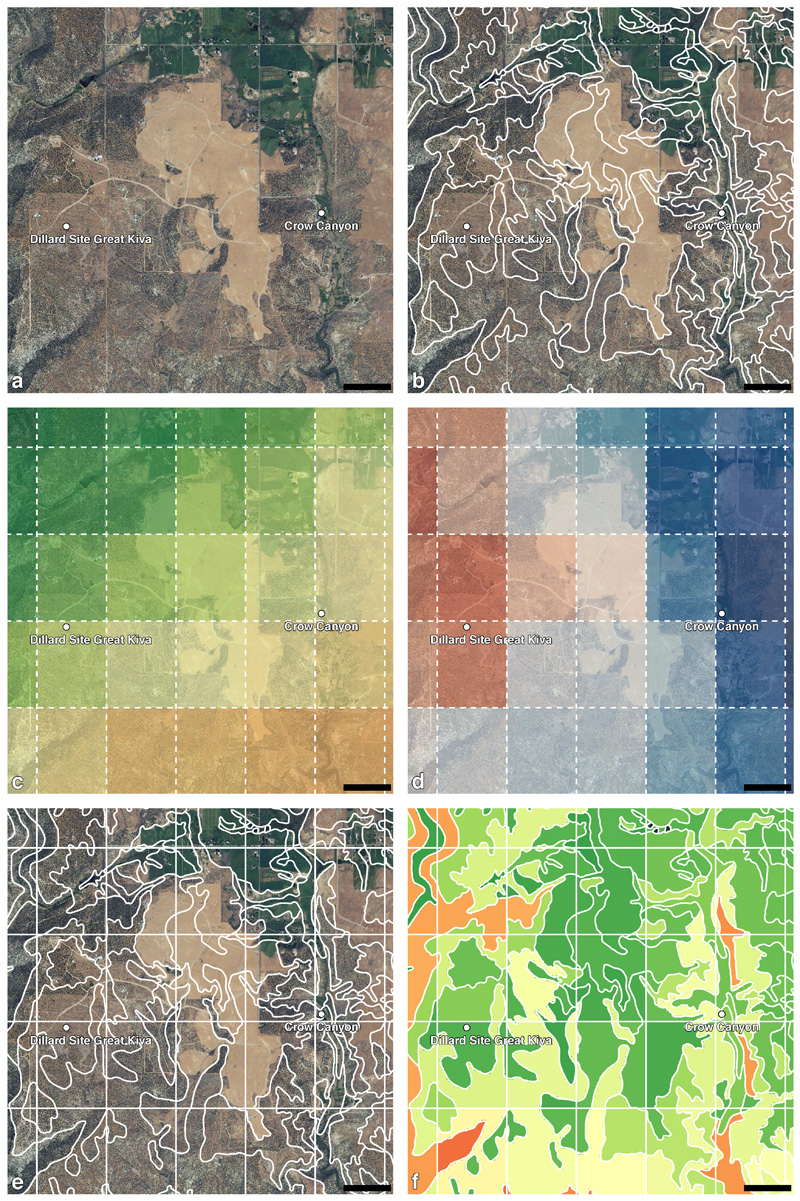
Building-Blocks for Estimating Ancient Maize Productivity Around Crow Canyon Archaeological Center, Cortez, Colorado Panel (a) show a bird’s-eye view of the area. Panel (b) shows the soil type boundary polygons defined during soil surveys run by the United States government. Panels (c) and (d) show the modern amount of rain and modern mean temperature, respectively, which are calculated from regional weather stations. In panel (c), green is wetter and red is drier; in panel (d), blue is cooler and red is warmer. Finally, all of those data sets are layered in panel (e), which generates unique combinations of soils, temperature, and precipitation. In panel (f), independent maize productivity reconstructions are calculated across the landscape; darker green indicates greater potential maize production. Scale bar: 0.5 km.
Graphic by R. Kyle Bocinsky (orthoimagery and soils data provided by the U.S. Geological Survey) |
||
| Copyright © 2015 by Crow Canyon Archaeological Center. All rights reserved. |


