

| Question 4 supporting material | ||
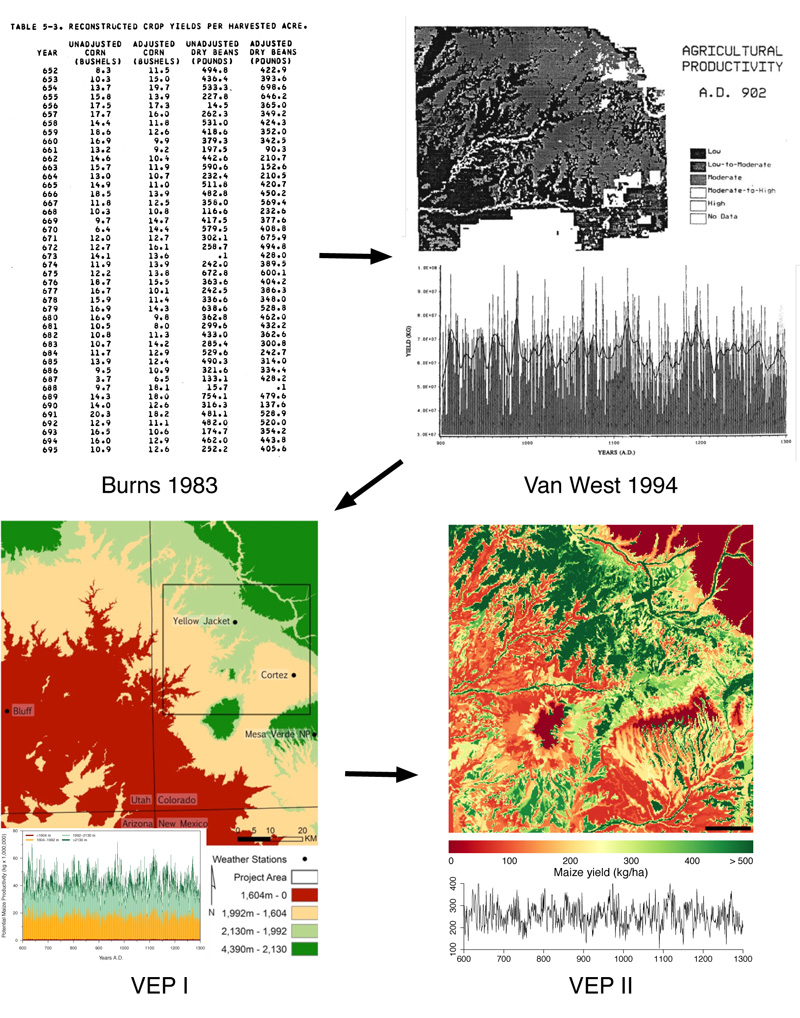
The History of Maize Paleoproductivity Reconstructions in the VEP North Area The upper-left panel shows paleoproductivity data as presented by Barney Burns in his 1983 Ph.D. dissertation. Burns, working in the late 1970s and early 1980s, did not have the technological capacity to easily represent his reconstructions graphically. In fact, there were only three figures in his entire 805-page dissertation! All of his statistical calculations were coded in Fortran 77 and were run on paper punch cards at the University of Arizona. Burns and Malcolm Cleaveland wrote the computer program “FOOD,” which is fully reproduced as Appendix 8 in Burns’s dissertation. The panel shown here is a partial scan of Table 5.3 in Burns’s dissertation. The upper-right panel shows paleoproductivity data presented by Carla Van West in her 1990 Ph.D. dissertation, which was subsequently published in 1994. Van West, working at Washington State University, had access to state-of-the-art computing facilities for the time (late 1980s), including the early geographic information systems VICAR/IBIS (which operated on a mainframe) and EPPL7 (which was on a desktop computer, then called a “microcomputer”). VICAR continues to be developed, maintained, and used at NASA’s Jet Propulsion Laboratory. EPPL7 is a raster GIS back-end still used in the EPIC GIS system developed by the state of Minnesota. Van West created color graphics that at that time could be presented only on computer screens; all the figures were formatted for black and white dot-matrix printers. The panel shown here combines Figures 4.3 and 5.1 from the 1994 published version of her dissertation. The lower-left panel shows paleoproductivity data as presented during the first phase of the VEP (“VEP I,” 2001–2007). Early VEP researchers had access to contemporary GIS, statistics, and database technology. All analyses were done using Microsoft Excel for data entry and tabulation, ESRI ArcGIS for geospatial organization and extraction of soils and elevation data, and the SAS statistical package for paleoclimate reconstructions. This map shows the four elevation bands used to estimate temperature and calculate the Palmer Drought Severity Index, a measure of soil moisture. The inset graph shows the potential maize yield in each of the four elevation bands. The VEP I study area, which conforms to Van West’s study area, is outlined in black. This panel combines Plates 6.3 and 6.6 from a chapter by Tim Kohler in Emergence and Collapse of Early Villages, a 2012 University of California Press book that reports on the results of VEP I. Finally, the lower-right panel shows paleoproductivity data produced during the second phase of the VEP (“VEP II,” 2008–2014). Kyle Bocinsky automated the VEP I paleoproductivity reconstruction method by scripting it in the R programming language, in lieu of using a GIS. All steps of the reconstruction—from extracting raw data from federal databases in the United States to exporting reconstructed production data-planes for use in the Village simulation—are now completely automatic. The entire process (with the exception of calculating soil moisture) can be run on a personal computer in less than an hour for the VEP North study area. The video below shows the entire VEP II reconstruction, from A.D. 600 to 1300. Highly productive areas are shown in green; nonproductive areas are shown in red. Yellow indicates areas where a Pueblo family could just make ends meet.
|
||
| Copyright © 2015 by Crow Canyon Archaeological Center. All rights reserved. |


